
The greatness of a man is not in how much wealth he acquires, but in his integrity and his ability to affect those around him positively. — Bob Marley
This article is for long-term investors. Like many of you, I have a full-time job which I enjoy doing. We don’t watch the crypto market very often and definitely not a day trader.
As of this writing, Oct 22, 2021 — — Bitcoin, Ethereum and most altcoins are still in the bull run. Bitcoin hit an all time high of $66,909 (according to Coinbase) on 10/20/21.
I have started thinking about taking some profits. Cryptocurrencies are volatile and during most corrections, it can go down 50% or more based on past few years of experiences. Knowing when to sell, which coins to sell etc are key to a successful and fulfilling investment experience.
In this article, I am sharing a few easy steps you can implement in your (partial) exit. These techniques require minimal efforts and workable for long term investors.
Why Sell
I am an advocate of forever buy-and-hold strategy for many years but I have come to understand that there are good reasons to sell some , not all, of my crypto holdings:
Sell the altcoins you bought by mistake or unintended or by some bad recommendations. It is a good opportunity to trim your portfolio as most altcoins would have gone up as well. Cleaning up our own mess in life and in cryptos is a good thing.
Rebalancing your portfolio by selling coins which are a big portion of your portfolio
Taking profit and reward yourself is a good felling. We all need to love ourselves.
It’s ok to lock-in some profits and pay some taxes. Most coins drop 50% or more in a major correction so after taking into account of tax implications, you are still much better off sell near peak and buy back later.
It allows you to deploy your new capital to other asset classes with better risk/reward ratio.
However, my bigger concerns are the followings:
Systemic risks exist in cryptocurrency market, e.g. Tether (USDT), exchange frauds etc. It takes time for these systemic risks to come to fruition and we just don’t know when. Therefore it is always good to take some profits.
New controls and regulations by various governments including new taxation law. Again, we don’t know when but government interference is a sure thing.
The cryptocurrency remains vulnerable to macro risks and potential risk-off in traditional markets.
As you can see, the road to profitability is not a straight line. By aligning your long term investment strategy with some risk management, your journey to riches will be more enjoyable and more zen, being at peace at every moment.
When to sell
As a long term investors, our main goal is to capture most of the trend .Instead of using my gut feeling, I use a few indicators in combination to objectively determine the best timing to sell.
When Crypto Fear & Greed Index reaches 80 and 90.
Warren Buffett once said that it is wise for investors to be “fearful when others are greedy, and greedy when others are fearful.” This indicator implement just that. You can access from https://alternative.me/crypto/fear-and-greed-index/ which is a metric developed with the following weightage:
Volatility (25 %)
Market Momentum/Volume (25%)
Social Media (15%)
Dominance (10%)
Trends (10%)
Surveys (15%) currently paused
Let’s compare this chart with BTC price chart


Crypto’s Greed Index went through a consolidation phase (colored yellow box below) for a few months before the market becomes less greedy i.e. the start of corrections.

Utilizing these indices is both an art and a science. As a long term investors, or any investors, we are not selling at its peak. We are selling some cryptos, close to its peak to capture most of the moves.
When Retail FOMO is in
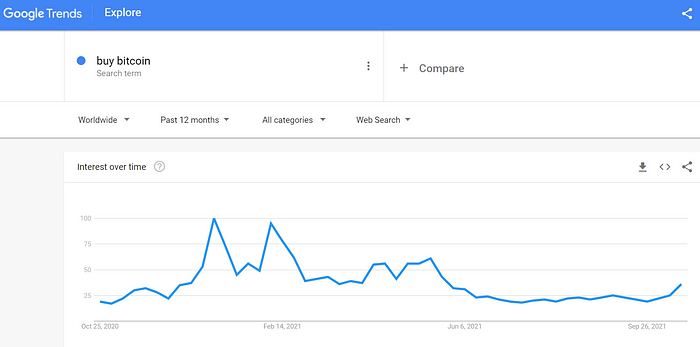
As of this writing (10/22/2021), the retail FOMO is still absent from current Bitcoin’s bull run. The following Google Trends on search keywords bitcoin, ethereum, buy bitcoin are still below the previous peaks. The key level to watch out are 80 and 90.
The following screens show the searches peaked around May 2021, at 90/100 level.


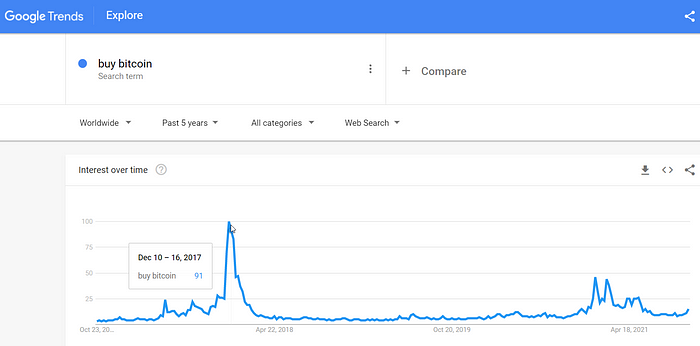
It is interesting to note that looking at 5 years of Google Trend data, the retail FOMO for the last 2 years are way below what we had in December 2017. We still have some good run in this bull market.
When Mayer Multiple Indicator close to 2
The Mayer Multiple measures the spread between bitcoin’s price and the 200-day moving average (MA). As of 10/22/2021, the metric is 1.35, which is well below the 2.963 threshold which previous bull markets peaked in December 2017.


When the price reaches unsustainable level: 2 sigma to 3 sigma of Bollinger Bands
Bollinger Bands® is a powerful tool that I used frequently for technical analysis. Their dynamic nature in relation to volatility allows them to be used on different cryptocurrencies with the standard settings.
Developed by John Bollinger, Bollinger Bands® are volatility bands placed above and below a moving average. Volatility is based on the standard deviation, which changes as volatility increases and decreases. The bands automatically widen when volatility increases and contract when volatility decreases.
In this scenario, we are using Bollinger Bands to detect price extremities for a specific cryptocurrency e.g. BTC, ETH, ADA etc. While the Crypto Fear & Greed Index and Google Trend tell us the overall market, Bollinger Bands can be applied to a specific crypto.
Use default settings for Bollinger Bands (20,2): 20-day simple moving average, which is middle band, the 2 standard deviations.
Anything above two standard deviations (5% of price actions) or three standard deviations (0.3% of price actions) are price extremities. These are rare and anything close to 3 sigma is not sustainable.


The %B indicator of Bollinger Band at the bottom of the chart quantifies this further and make things a bit easier. %B shows where price is in relation to the bands.
%B = 1 when price is at the two-sigma band
%B > 1 when price is above the two-sigma band
What to sell
If you are a conservative investor:
Sell the altcoins you bought by mistake or unintended.
Rebalancing your portfolio by selling coins which are a big portion of your portfolio.
If you are more speculative investor, here are some techniques you can use to maximize short term profits:
Sell some of your Bitcoin and buy big cap or small cap altcoins if we are still in Wave 1 (Bitcoin going up).
Sell some of your Bitcoin or big cap coins if we are still in Wave 2 (Top 50 big cap coins going up). Please do your own research and execute with caution. Wave 3 is the last cycle is when all the altcoins going crazy with insane price.
Capital Flows in Waves
From the past data, capital flows in the crypto market in a recognizable pattern, from larger to smaller market cap tokens and back to Bitcoin and fiat.
Wave 1: Capital first enters Bitcoin. This requires the least investor risk profile.
Wave 2: Profits then rotate into big cap coins which is loosely defined as Top 20–50 coins in market cap. These include Layer 1 like ETH, ADA, DOT, SOL etc.
Wave 3: Profits from big cap coins then rotate to the mid and small cap coins, as investors raise their risk profile to chase returns.
Lastly, capital flows back to Bitcoin, stablecoins and fiat as the entire market becomes greedy and too hot.

Placing your sell order
Use a limit order when possible instead of market order.
Use Bollinger Bands two-sigma and three-sigma to determine the price to sell.
Progressively sell selected cryptos at key levels of the above 3 indicators. Just like we use Dollar Cost Average (DCA) to buy cryptos, we can use DCA to get sell the cryptos.
As of 2021-Oct-23
We are still in the bull run and retail FOMO is not in. According to renowned pseudonymous quantitative analyst PlanB’s Stock-to-Flow model, the approximate price for Bitcoin by end of the year is about $100K. Anthony Pompliano actually interviewed PlanB on Oct 11, 2021
I am grateful that PlanB is a real person and he is open to interviews.
Here are the key excerpts from the interview:
“I would be very, very surprised if Bitcoin’s price would be below $100,000 at the end of the year. That would sort of invalidate my view, my models, and that would certainly surprise me. I do think we will see a price that is at least $135,000 by Christmas because that’s what my floor model says. Basically I’m using three kind of models that all say the same thing.”
PlanB says his three models are the S2F, which is traditionally used in the commodities markets to derive price based on the flow of supply, another model which utilizes on-chain signals, and lastly a floor model that aims to find the lowest possible price for Bitcoin.
“If we look at the on-chain signals right now, I would say that top is at least a couple of months, say six months from here, so that would be end of Q1 [of 2022], maybe later.”
“I guess we will be above $100,000 [or] above $135,000 at the end of the year, and we’ll continue to grow maybe towards the S2FX model targets, $288,000 or even above. I would not be surprised even to see in Q1 or Q2 next year, prices of $300,000, $400,000, $500,000…”

The prices in Stock-to-Flow model is not an exact science but a guide line. I will start setting up my partial exit strategy when Bitcoin hits around $80K and $90K.
From PlanB’s earlier tweet on June 20, 2021, Bitcoin prices to be > $98K in Nov and >$135K in Dec:

Conclusion
Using a few simple techniques which are publicly available for free (Crypto Fear & Greed Index, Google Trends, Mayer Multiple, Bollinger Bands), we can learn to take some profits off the table. Rewarding ourselves and enjoying our fruits are an important part of this journey. After all, it is a long journey so why not have fun along the way?
There is no better feeling than taking back our capital and less the rest run with house money.