
The market doesn’t move on secret or overly complex tools, rather the opposite. The market moves these tools. In the mind of an experienced trader, the simplest technical analysis tools are the ones the majority of people see and that’s what price action is based upon

In crypto trading, there are a ton of things you could be doing wrong. But the most common thing that prevents people from becoming successful crypto traders is taking the wrong approach in Technical Analysis.
Trading is not simple, but it can be, especially in crypto where TA seems to drive price action, most of the time.
Technical analysis or simply “TA” is a loose term in crypto circles. In other words, TA is deeply misunderstood by a majority of traders. The general belief is that anyone can become a profitable trader by selecting a couple of TA indicators and following through dozens of textbook rules.
It turns out, the reason why people follow this approach is because they believe the market moves because of indicators.
I will admit, I was once one of those people.
But I unlearned.
The market doesn’t move because of indicators
Gooner further says, “the most important data on the chart is candles (prices) and volume. If you learn to better understand those two things then you can rely less on indicators and more on the chart itself.”
That’s a very useful insight right there.
But if price and volume history are so important, how do you even begin using them in trading?
To start, we need to define the term “Technical Analysis”. This one is simple.
TA is defined as a type of analysis that aims to predict future market behavior based on previous price action and volume data.
Typically, traders who use TA employ a variety of different indicators and metrics to try and determine market trends, based on charts and historical price action or market structure.
However, despite relying on historical data, TA is still influenced by personal bias and subjectivity. For instance, a trader who is strongly predisposed to reach a certain conclusion about an asset will probably be able to manipulate his TA tools to support their bias and reflect their preconceived notions and, in many cases, this happens without their awareness.
Moreover, TA indicators can also fail you during periods in which markets don’t present a clear pattern or trend.
For example, “MACD turns bullish” often, but what is the context? Are you really going to long just because it turned bullish in a bearish macro and micro trend? It’s still a bad decision based on that information alone and yet I see it happen too often.
That’s why you must learn to read and understand the real meaning of the prices and volume data displayed on your chart without the help of indicators.
Why is this important?
Because any trading chart, irrespective of the timeframe, has miniscule and important details or setups which are hard to spot with an indicator but can, surprisingly, be uncovered with the naked eye.
Understanding the data on the chart
When you open a Bitcoin chart or a trading chart for any other cryptocurrency, what you see is a trade history or market structure.
Trade history can be partitioned into groups. And each group is used to generate a candlestick.
A candlestick is made up of the open high, low and close price data. These values are also known as OHLC and are used to build each candlestick.
The intervals or periods that determine the size of each candle are arbitrary. You could choose any timeframe but the most common is the one day interval. Candlesticks take an arbitrary number of trades in any given period and transform this data into a single candlestick with only four values (OHLC). We lose all the data and information regarding the number and size of trades that occurred in the period.
This is where volume comes in.
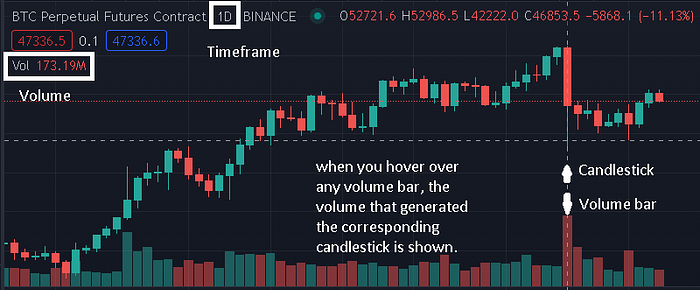
You’ll mostly see a volume overlay by default in most candlestick charts. Whereas price and time values are used to generate candlesticks, the trade size is used to generate volume bars that are usually displayed at the bottom of the chart. The volume represents the total amount of the asset that was traded in each period.
The open high low and close values for the last candlestick are displayed at the top of the chart. The volume data is displayed there as well.
In summary, it’s important to realize that candlesticks give us a visualization of the trade history. But if you are looking at candlesticks without the volume, a good bit of the information is lost. Adding volume provides a clearer picture of the trade history during each period.
To check volume that was traded in any given timeframe, you just need to open your chart and hover over any candlestick and the volume data will be populated. On tradingView, volume is shown near the top left of the chart.
Price action is second to none
As previously mentioned, relying on indicators to make your trading decisions is a bad habit, and can be costly. Not trying to trash indicators here. I’m just saying Indicators are second to price action and market structure. Below is a better analogy of what indicators are.
The problem with indicators is that they can easily fool you.
For instance, when an asset trends as hard as Bitcoin does, there will always be divergences. Here, I mean bull or bear divergences.
At the end of the day the important questions are, is the market structure bullish on the macro and micro? What is the trend? What is the strength of the trend? The fact is something can remain overbought or oversold for a very long time. Price can go against reason and indicators for what seems like forever.
The reality though is, if you rely too heavily on indicators in a small trend, you’re likely going to try to catch the divergences and you will keep losing money because you’d be counter trading the trend.
In such a situation, your best bet is waiting for trend confirmation.
And how do you confirm a trend? It’s simply by checking volume.
Volume is not a silver bullet but it works, at least in crypto.
Something important to note is that a move without volume is fake.
Volume simply confirms price action.
Volume at a glance
Volume indicates a buy and sell. So, it not only matters how much volume but also at what price are people willing to pay? If everyone is buying at the market rate, that will only push the price higher. Similarly, if everyone is selling at the market rate it will push the price lower.
This is a key misunderstanding that takes time to understand. Essentially, 1 volume equals 1 sell and 1 buy. These are always equal, but if no one wants to sell at 100 dollars then the price has to move up and vice versa.
Moving on, strong or increasing volume shows increased interest. In other words, this type of price action interests many traders.
If there is an uptrend with strong volume, that shows more certainty & reliability in the trend.
In the above example, it shows the majority of the market is bullish and enthusiastic. It also adds validity to the breakout. That is, a large number of traders believed this was a monumental turning point, and likely to believe in further upside. The move further adds liquidity for larger players to join in, and generally price action is easier to trade.
On the flipside, low volume breakouts signal diminishing confidence. Clearly, not many traders are interested at that point. In this case, price action will likely be choppy and more likely to fakeout.
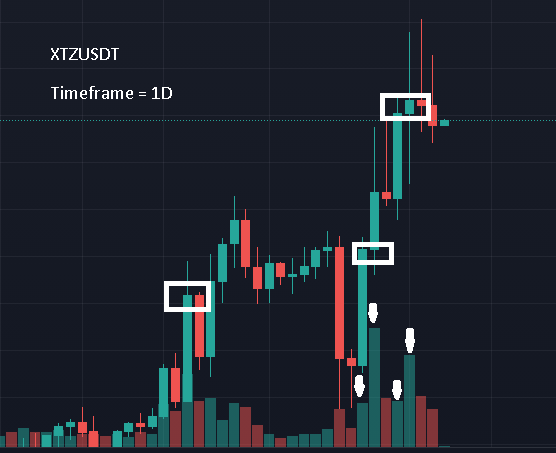
Lastly, high volume dumps at the end of strong trends can also be a good sign of a reversal, or at least a good sign of caution.
The reverse is also true. This means high volume pumps at the peaks of super extended moves can also mark the top as well. Such moves signal imminent liquidations, lots of overenthusiasm, and lots of positions taken at overextended prices leaving a good chance that many traders will get trapped or stopped out suddenly.
Candlestick patterns are for the most part bullshit
Textbook candlestick patterns and chart patterns will rarely play out in your favor in crypto.
Still, you should elevate your game in candles to the point where you can still see setups even without context.
Take this example.
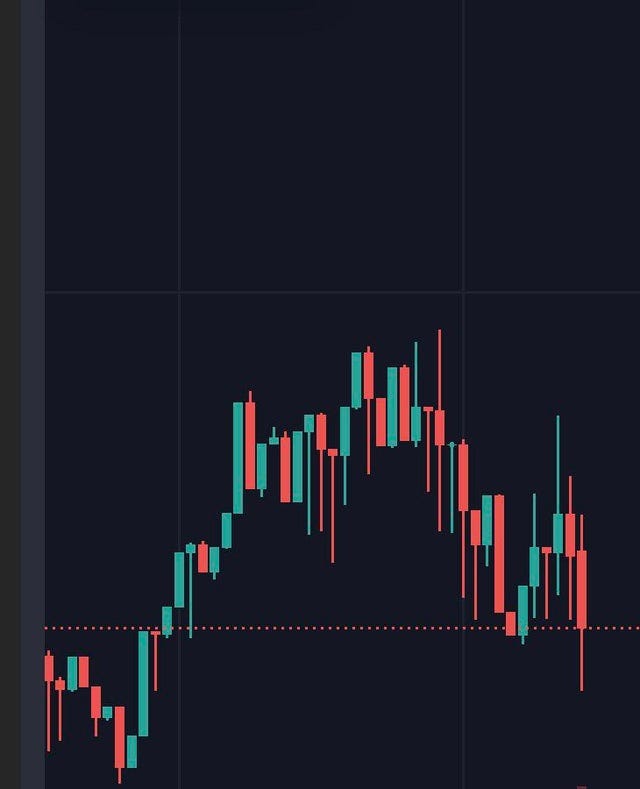
If this is all you had regardless of the timeframe and volume, what do you see?
I totally understand that this is not the ideal scenario to trade if this is all you have, but the truth is there is a way you can still describe what’s happening and even what will happen next.
Here is what I mean.
What the above chart shows is what an experienced trader sees with a quick glance. Without any help from any indicators, you can still read momentum or order flow that has occurred over the time. And this confirms there is a learning, execution and management curve that all traders have to go through before they are consistent profitable traders.
Conclusion
As we have learned, textbook trading hacks like candlestick patterns and chart patterns don’t always happen in crypto.
It’s also true that there is no one size fits all trick in crypto trading. What is important is to be a little flexible and also try to understand the logic behind every price action.
Generally speaking, I want to see the highest volume on candles that work with my bias. If I have a bullish bias, I want big strong green candles and lower volume resting red candles on pullbacks. In this case, if you are long and suddenly start seeing big red volume candles, that could signal that there are a lot of sellers present.
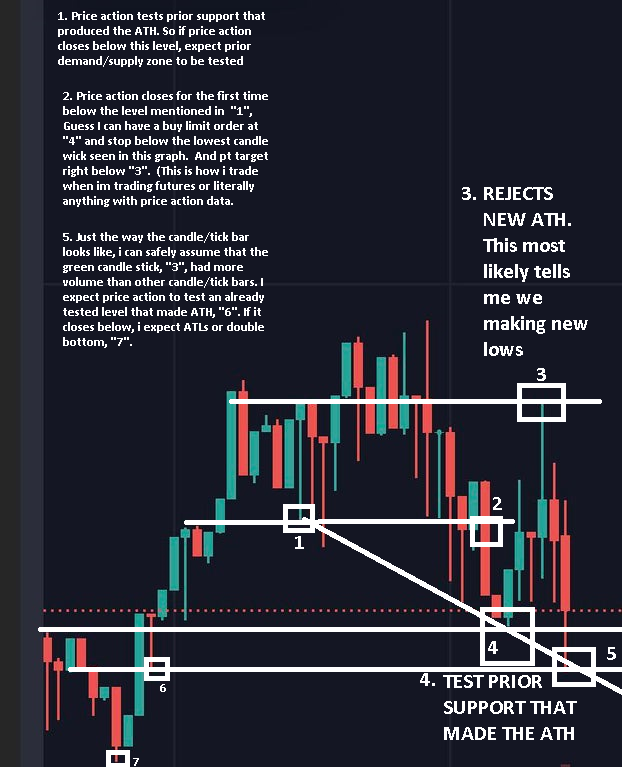
Something else to note is that support and resistance levels are only good if the market respects them. Drawing a line above or below a past event doesn’t mean anything. As earlier mentioned, TA is subjective. So, there has to be enough players in the market who also identify the level as significant in order for the level to have an effect.
Additionally, levels should be tested at least twice before you can call them support or resistance.
Lastly, what seems like the typical bullish price action won’t work in every scenario.
So, always use stop-loss to counter this issue.